Test Details
After choosing a test from the list to analyse, you can reach the reports and graphs from the tool bar shown below.
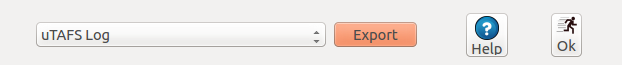
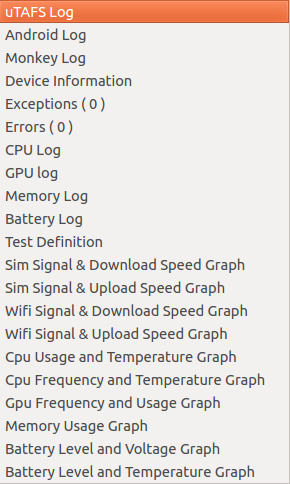
The complete list of reports and graphs appears as:
Test reports and graphs can be transfered with "Export" button in .jpeg and .log formats.
- Wait till the test is over.
- Connect the device to the computer. (If disconnected before)
- Read the logs from the connected device by "Read The Logs" tap.
- Click the "Analysis" tap and search for "Device", "Test Group" or "Test Date"*.
- The reports will be listed on requested search.
- Open the requested test result by double clicking, in order to see the "Test Details" screen.
- Choose "uTAFS Log" to monitor in uTAFS form.
- Choose "Android Log" to monitor in Android form.
- Choose "Monkey Log" to monitor Monkey Test details.
- Choose "Device Information" to monitor Device Information Logs.
- Choose "Exceptions" to monitor Exceptions.
- Choose "Errors" to monitor the Errors occured during the test.
- Choose "CPU Logs" to monitor the Changes occured in the CPU during the test.
- Choose "GPU Logs" to monitor the Changes occured in the GPU during the test.
- Choose "Memory Logs" to monitor the Changes occured in the Memory during the test.
- Choose "Battery Logs" to monitor the Changes occured charging/discharging of battery during the test.
- Choose "Test Definition" to monitor the Test Definition in XML Form.
- Choose "Sim Signal & Download Speed Graph" to monitor the Sim Signal & Download Speed Graph.
- Choose "Sim Signal & Upload Speed Graph" to monitor the Sim Signal & Upload Speed Graph.
- Choose "Wifi Signal & Download Speed Graph" to monitor the Wifi Signal & Download Speed Graph.
- Choose "Wifi Signal & Upload Speed Graph" to monitor the Wifi Signal & Upload Speed Graph.
- Choose "CPU Usage and Temperature Graph" to monitor the graphs of temperature differences occured at the Cpu and Device during the test.
- Choose "CPU Frequency and Temperature Graph" to monitor the graphs of fluctiation at Cpu and temperature differences occured at Device during the test.
- Choose "GPU Frequency and Usage Graph" to monitor the graphs of fluctiation and usage at Gpu occured at Device during the test.
- Choose "Memory Usage Graph" to monitor The Momentry Memory Usage while the test is running.
- Choose "Battery Level and Voltage Graph" to monitor The Momentry Battery Level and Voltage while the test is running.
- Choose "Battery Level and Temperature Graph" to monitor The Momentry Battery Level and Temperature while the test is running.
*As the logs are kept in the device, the test date is the date of tested device. Please note that, the date and time adjustments are correct before starting tests.